Data Massaging
- Sarita Upadhya
- Jul 24, 2025
- 5 min read

For any machine learning task, the first step is to ensure that the data being considered is clean, reliable, aligned with the business objective to be achieved, taken from the recent past reflecting the current business scenario thus validating that it is fit for the purpose it is being used for. However, in real life situations data quality is usually a challenge, may be because it is collected manually, not standardized as per compliance or underlying rules, corrupted during data migration or many other reasons. Hence, checking the data and massaging it before proceeding with further analysis or implementation becomes crucial.
In this article we will pick up data from the finance domain which is available here. Further we will identify data quality issues and try and fix them using different possible techniques.
About Data:
Data is published by MIT on Kaggle and the objective is to build a classification model to predict credit defaulters. There are 12 columns or features in the dataset and all are numeric data types. Let us massage this data, identify all possible challenges, and arrive at appropriate cleanup solutions. Data has 150000 observations and each observation corresponds to a customer who has either defaulted or not defaulted.
Field Name | Description |
ID | Unique Identifier |
Default | Binary variable to indicate if a customer has defaulted (1 indicates default and 0 indicates no default). Target variable to be predicted. |
CC_Usage_last_month | Percentage of credit card usage in the last month |
Age | Age of the customer |
Num_loans_payment_delays_3_months | Number of loans with payment delays of more than 3 months in the last 3 years |
Debt-to-income_ratio | Financial debt-to-income ratio |
Monthly income amount | Monthly income amount |
Num_loans_and_Num_cc_last_year | Number of loans (including vehicle or mortgage loans) and number of credit cards last year |
Num_loans_payment_delays_60_days | Number of times the client has been over 60 days late in the last 3 years |
Num_mortgage_loans | Number of mortgage loans |
Num_loans_payment_delays_30_days | Number of payment delays over 30 days in the last 3 years |
Num_dependents | Number of dependents |
Data Quality Issues:
Observations from Statistical Summary:
| Mean | std | min | 25% | 50% | 75% | max |
CC_Usage_last_month | 6.05 | 249.75 | 0.0 | 0.03 | 0.15 | 0.56 | 50708 |
Age | 52.3 | 14.77 | 0.0 | 41 | 52 | 63 | 109 |
Num_loans_payment_delays_3_months | 0.42 | 4.19 | 0.0 | 0 | 0 | 0 | 98 |
Debt-to-income_ratio | 353.00 | 2037.81 | 0.0 | 0.18 | 0.37 | 0.87 | 329664 |
Monthly income amount | 6670.22 | 14384.67 | 0.0 | 3400 | 5400 | 8249 | 3008750 |
Num_loans_and_Num_cc_last_year | 8.45 | 5.15 | 0.0 | 5 | 8 | 11 | 58 |
Num_loans_payment_delays_60_days | 0.27 | 4.17 | 0.0 | 0 | 0 | 0 | 98 |
Num_mortgage_loans | 1.02 | 1.13 | 0.0 | 0 | 1 | 2 | 54 |
Num_loans_payment_delays_30_days | 0.24 | 4.16 | 0.0 | 0 | 0 | 0 | 98 |
Num_dependents | 0.76 | 1.12 | 0 | 0 | 0 | 1 | 20 |
Below is the list of observations for every field:
Field Name | Observation |
CC_Usage_last_month | The maximum value of “CC_Usage_last_month” seems to be very high. As it is a percentage field, anything beyond a value of 100 seems to be incorrect. |
Age | The minimum value in “Age” field is 0 which is incorrect or bad data. |
Debt-to-income_ratio | The maximum value of “Debt-to-income_ratio” is too high. 75% of the records lie in the range of 0 through 0.87. Valid values should be between 0 through 1 |
Monthly income amount | · Minimum value of “Monthly income amount” is 0 which seems incorrect. · Maximum value of “Monthly income amount” is too high. |
Missing Values:
Field Name | Count of Null values |
Monthly income amount | 29731 null values out of 150000 records |
Num_dependents | 3924 null values out of 150000 records |
Imbalance in Data (Classification Problem):
A classification model can be trained well, if the data is balanced. That is, there should be near to equal number of records in each class. If the data is balanced, the model being trained will have a good representation of data belonging to each class and will be able to learn the difference between the them effectively.
In the data we are working on, “Default” field is the target variable which has to be predicted using a classification technique and is binary in nature. So, we need to check if there is an equal representation of data for defaulters (value of 1) and non-defaulters (value of 0).
It is observed that 139974 records almost 93% of the total data belong to non-defaulters (value of 0) and only ~7% of the data belongs to defaulter class (value of 1) which we are interested in. Hence, there is a huge imbalance in the data which must be addressed.
Observations from Data Exploration:
223 records have “CC_Usage_last_month” greater than value of 100.
35065 records have “Debt-to-income_ratio” greater than value of 1.

There are 4 customers with “Monthly income amount” more than 1000000
165 records with “Monthly income amount” less than 100 including 0 values.
1 record with “Age” field as 0.
Suggestion to Fix the Data Quality Issue:
Field | Issues | Impact | Suggestion |
CC_Usage_last_month | The maximum value in “CC_Usage_last_month” seems to be very high. As it is a percentage field, anything beyond a value of 100 seems to be incorrect. | 223 records (0.14% of total records) | Can be separated from the original dataset and shared with business for correction. |
Age | The minimum value in “Age” field is 0 which is incorrect or bad data. | 1 record | As it is just 1 record, we can replace 0 with median value 52 to this record. |
Debt-to-income_ratio | The maximum value of “Debt-to-income_ratio” is too high. | 35065 records with value greater than 1 (23%) | As the number of bad records is high, and it is an important feature for predicting defaulters, these records need to shared with business for correction. |
Num_dependents | Null Values | 3924 (2.6%) | We see that around 50% of the data has number of dependents as 0. As the impact is low, we can apply a logic based on “Age”. By grouping our data for different age-group we can find out the median value of dependents for each group and impute that in the missing records. |
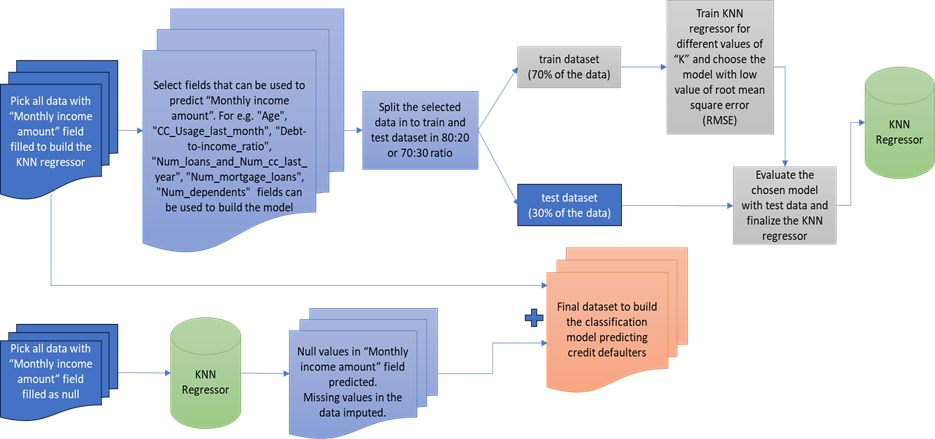
Monthly income amount | - Null Values - Minimum value of “Monthly income amount” is 0 which seems incorrect. | 29896 records (29731 + 165 ~ 20%) | Convert low value data points to null value. With the good data that is available build a KNN prediction model to predict monthly income field and fill in the missing data in the original dataset |
- Maximum value of “Monthly income amount” is too high. | 4 records | Exclude the 4 records as they are non-defaulters. Also, check for possible clusters in the data, separate them and then build the classification model for each cluster. |
Missing Data imputation using KNN Regressor:
Concluding Notes:
All suggestions are implemented only after careful considerations, discussion with business and after written approvals.
While implementing the above suggestions we need to keep a constant check on the imbalance in the data and ensure it does not further increase as our primary objective is to build a classification model to predict credit defaulters.
For the issue related to imbalance in data, under-sampling can be done to get balanced datasets. Multiple such datasets can be extracted through random sampling; classification prediction model can be built for each dataset and final predictions to be arrived using ensemble technique.
Collect, scrape or pick up data from the domain you are interested in, explore, identify issues, fix them and proceed further with forecasting, predictions or identifying patterns in data which will be useful to your business.


Comments